This edition of Modern Restaurant Management (MRM) magazine's Research Roundup features evolving dining trends, GLP-1 impact on F&B, lunch trends, and most mentioned attributes in Google reviews for small businesses.
Why Are People Dining Out?
Epsilon's recent study asked consumers about their reasons for dining in or dining out, special occasions and other motivations. With rising costs, people have started to get creative, whether that’s by forgoing appetizers or sharing entrées, going out less frequently or prioritizing casual over fine dining.
-
51 percent of people say they plan to go out for dinner just as often as they do now.
-
Second to socializing, the top reason to go out to eat for Millennials is for a treat or indulgence, while for Gen Z and Gen X, it's when they don’t feel like cooking.
-
On average, Gen Z goes out for dinner the most at an average of 4.1 times per month.
-
4 in 10 choose a restaurant based on if it has a loyalty program.
As dinner trends evolve, how are consumers spending?
Dining—and specifically going out to dinner—is experiencing an evolution.
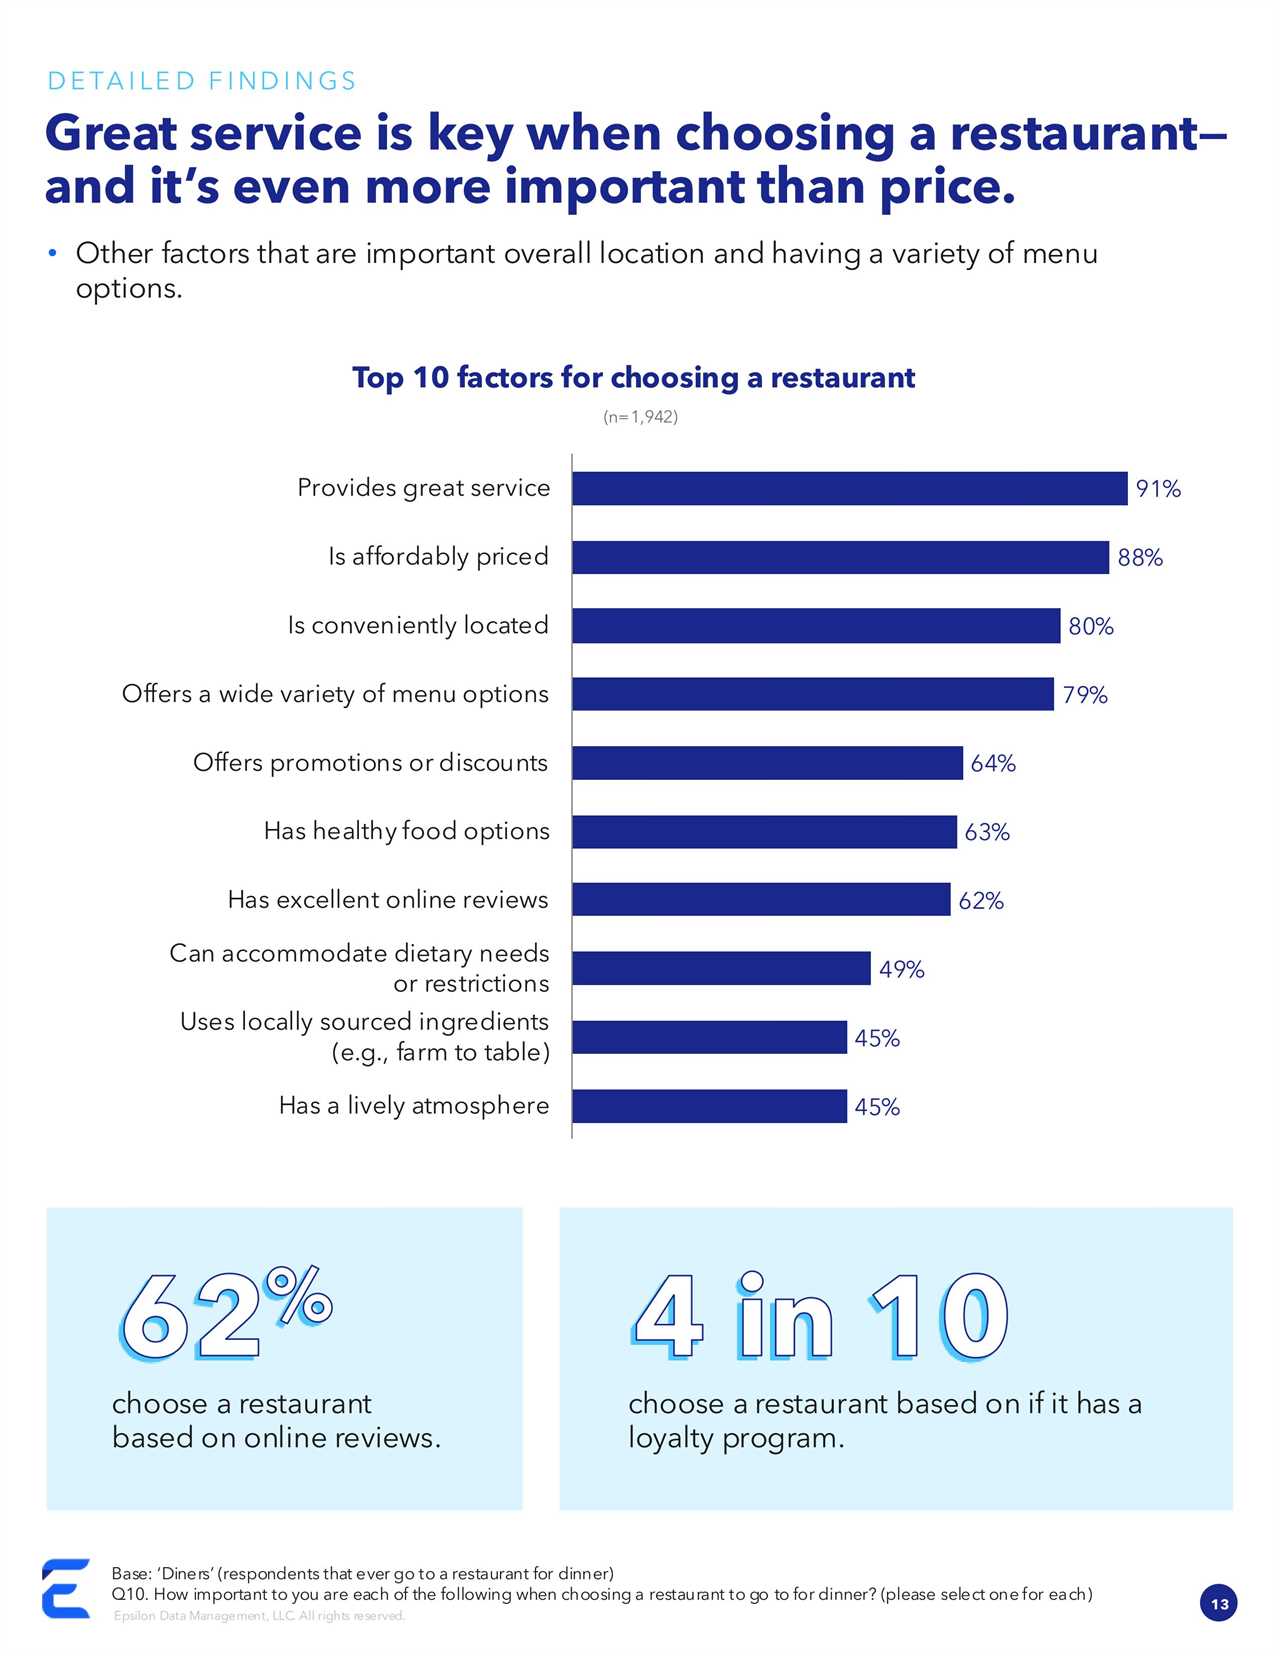
With rising costs and inflation, people have started to get creative, whether that’s by forgoing appetizers or sharing entrées, going out less frequently or prioritizing casual over fine dining.
"Understanding how consumer preferences and expectations are evolving is critical, especially in a category like Dining, which is so emotionally driven and experience focused," says Brian Giannone, Epsilon's Senior Vice President of its Dining Vertical. "Brands that succeed in creating loyalty with guests are those that harness the power of data and technology to deliver on personalization and relevance along the guest journey. Research like this supports why it’s imperative to understand what motivates each guest so that brands can create value that resonates across their customer base."
Gen Z Dining Habits
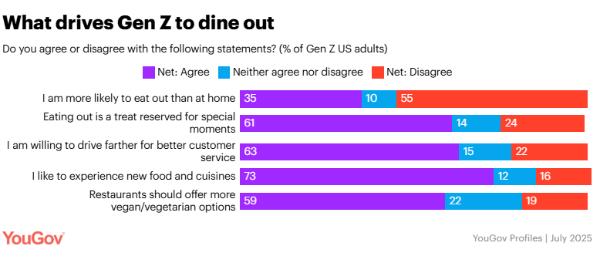
From late-night fast food runs to foodie Instagram posts, Gen Z is reshaping what it means to “eat out.” A new YouGov Profiles analysis uncovers how this generation views restaurants, what motivates their choices, and which brands are winning their loyalty.
Key findings:
-
Dining out is a treat - 61 percent of Gen Z say eating out is for special occasions, not an everyday routine.
-
Food discovery matters - Nearly three in four (73 percent) like trying new cuisines, but 37 percent admit they aren’t adventurous eaters.
-
Takeout is common but not dominant - 43 percent usually order in, while 38 percent say they don’t.
-
Community and service count - 58 percent say supporting local restaurants is important, and 63 percent will drive farther for better service or tech-enabled convenience.
-
Eco-conscious—but not fully committed - 31 percent eat more locally sourced produce, 25 percent more organic, 24 percent less meat, but 35 percent haven’t made any eco-related food changes.
-
Top quick service brands - McDonald’s (21.6) leads in purchase intent, followed by Chick-fil-A (13), KFC (10.6), and Taco Bell (8.7).
-
Top casual dining brands - Wingstop (12.3) and Texas Roadhouse (10.4) outpace competitors, with IHOP, Cheesecake Factory, and Olive Garden in the next tier.
This research paints a nuanced picture: Gen Z wants affordable, convenient food, but they also care about service, variety, and values. For restaurant operators and brands, it’s a roadmap to where dining dollars are headed next.
What's Driving QSR Visits?
Consumer confidence has become one of the main factors impacting quick-service restaurant (QSR) traffic, marking a significant shift in how and why consumers choose to dine out, according to restaurant technology leader Revenue Management Solutions (RMS).
In an analysis of the past 15 years’ lowest-performing traffic periods, RMS examined 10 key macroeconomic indicators to determine what truly drives guest visits in the fast-food sector. The results reveal a marked transformation in consumer decision-making patterns.
From Gas Prices to Confidence: A Paradigm Shift
Historically, gas prices and unemployment were highly correlated with decreasing traffic. However, in 2025, economic factors remain stable, yet guests report fewer restaurant visits, and QSR traffic is on the decline.
The difference? Consumer confidence - which has dropped 14 index points since 2023.
“Right now, confidence is king,” said RMS CEO John Oakes. “While traditional economic factors such as inflation, wages and fuel costs still matter, consumer confidence tells us how guests will behave in the weeks and months ahead. For example, our experts estimate that a 10-point decline in confidence could lead to a 0.5 percent to 2 percent decline in traffic within just two months.”
Price Sensitivity is Growing Amid Shifting Perceptions
For QSR operators, the message is clear: The industry’s future success depends on consumer perception, which is largely reliant on pricing strategies that protect guest traffic and margins.
In RMS’s most recent consumer survey, 75 percent of respondents believe that restaurant prices are higher than the previous month, despite actual QSR price increases stabilizing.
In Q2 2025, QSR average prices were up +1.3 percent year-over-year, significantly lower compared to +2.9 percent in Q2 2024 and +10.6 percent in Q2 2023. Yet, nearly 40 percent of respondents report spending less of their discretionary income on restaurants, underscoring a widening gap between perception and reality.
A Data-Driven Look Back: Understanding the Trends
Below are the main macroeconomic indicators that have had an impact on QSR restaurant traffic over the past 15 years:
-
2009-2011: Traffic was down as much as -4 percent, driven primarily by gas prices and unemployment.
-
2020-2022: COVID-19 restrictions and inflation drove traffic declines of up to -15 percent year-over-year.
-
2023 to Present: Rising inflation has created uncertainty, causing traffic to drop an average of -1.0 percent, in addition to the already significant drops during the COVID years.
2025 Hospitality Trends
-
Data-driven analytics helps shape guest experiences in 2025, with over 90 percent of cruise companies using it for personalization.
-
96 percent of hoteliers are investing in contactless technology this year.
-
Over half of the consumers (64 percent) embrace biometric authentication, with a growing trust in its safety.
The U.S. hospitality industry is forecasted to reach nearly $250 billion in 2025 and climb to $313.87 billion by 2030. A recent article by Escoffier analyzed key statistics in the hospitality industry to highlight the biggest trends, consumer behavior, and the latest tech innovations. The analysis considers the newest technologies, from contactless payments to AI and biometrics, as well as feedback from hotels, restaurants, cruises, and travellers.
Contactless and Mobile-Friendly Tech
Contactless services continue to develop across all industries, including hospitality. QR codes scanned so far in 2025 (globally) are 433 percent above 2021 levels, and the U.S. leads activity with a 38.31 percent share of total scans. Moving even further, surveys show that up to 95 percent of individuals who’ve made at least one mobile contactless payment say they’ve left their wallet at home at least once, relying on just their phone to make payments.
AI and Automation: From Chatbots to Biometrics
Fingerprints or Face ID are a part of another trend of advanced tech, with 64 percent of survey respondents embracing biometric authentication. Hotels are the most advanced hospitality sector to use AI, with around 89 percent of accommodations using AI for customer service. Restaurants follow second, with 75 percent of establishments planning or already using AI and automation services. When it comes to the customer’s side, 77 percent of guests are interested in using automated messaging or chatbots for customer service.
The Personalized Guest Experience
Beyond convenience and automation, personalization is becoming a defining pillar of modern hospitality, with 58 percent of brands saying personalization is one of their top priorities in 2025. Cruises are leading in data-driven analytics, and over 90 percent of the cruise companies use it for personalization. Hotels and restaurants are almost tied, and about 70 percent of restaurants send customers personalized offerings, including discounts on usual orders and birthday deals.
The Experience Economy: Wellness, Micro-Events, and Lifestyle Offerings
Travelers, especially Gen Z, are prioritizing authentic, unique, and immersive experiences over traditional luxury amenities. Over 80 percent of Gen Z travelers prefer niche experiences, while 61 percent of the same generation like to focus on wellness experiences in their travel plans. Over half of all travelers (52 percent), regardless of the generation, say authentic cultural experiences are crucial for their vacation, including festivals, learning crafts from local artisans, and participating in regional traditions.
Tension Points and Tradeoffs
While the hospitality industry continues to evolve, there are some internal frictions. While 47 percent of restaurant operators worry that tech might affect the human experience, only 18 percent report the actual harm. However, when restaurants go entirely contactless, with no personal interaction, they do suffer from poor customer experience. Additionally, many express concern for biometrics, especially when it comes to privacy and control.
Most-Mentioned Attributes in Small Business Google Reviews
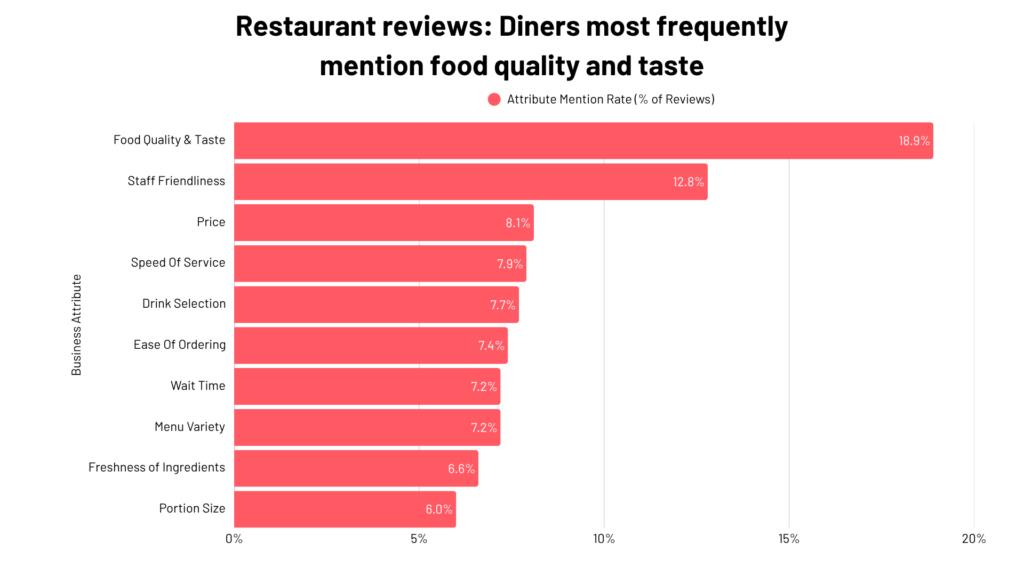
Staff friendliness is the most-mentioned attribute by customers in small business Google reviews, according to a study by Lanc Local.
The study, which analyzed more than million small business Google reviews, also examined frequently mentioned attributes within specific industries, such as hotels, where 41 percent of reviews mentioned room cleanliness.
The primary goal of this study was to identify what matters most to small business customers by using the attributes mentioned in their reviews as a proxy.
The dataset included one million Google reviews from 6,000 small businesses across various industries. Review dates range from 2006-2025, with a heavy emphasis on the last five years. Lanc Local used Python-based natural language processing to identify and quantify over 150 customer experience attributes.
Impact of Staff Friendliness: This study found that staff friendliness is the most frequently mentioned attribute in online reviews for small businesses, appearing in 13.1 percent of all reviews.
Strongest Drivers of Five-Star Reviews: The study discovered that the strongest drivers for customers leaving a five-star review are staff professionalism, product/service selection, and fair pricing.
Reasons for Low-Star Reviews: Low-star reviews are most often caused by problems with the payment process and inaccurate online information about the business.
Increased Importance of a Simple Process: Customers are increasingly looking for a simple process, with mentions of this attribute growing by 162.4 percent over the last two years compared to the two years prior.
Industry-Specific Findings: The study also revealed key industry-specific drivers, such as taste and food quality being the most mentioned attribute for restaurants, and staff helpfulness being a key factor for retail stores.
Among the restaurant-related findings:
- Taste and food quality comes up in 18.9 percent of all restaurant reviews.
- Food or drink quality is mentioned in 29.1 percent of coffee shop reviews.
While factors like staff, pricing, and speed also influence customer opinions, the primary focus remains on the food itself.
GLP-1 Growth Spurs Volatility in F&B
A report by OC&C Strategy Consultants reveals how the rapid growth in use of GLP-1 medications is impacting the Food and Beverage industry, driving reductions in consumption habits across key demographics and disproportionately impacting specific product categories.
GLP-1 medications, such as Ozempic and Wegovy, are poised for sustained growth, driven by a large addressable market linked to rising obesity and wellness trends.
Accessibility is improving through product innovation with new delivery formats and broader insurance coverage, which is reducing the financial burden on the consumer.
OC&C Strategy Consultants reveal that while there are early signs that adoption rates may slow, high churn and restart cycles are expected to fuel ongoing disruption. As a result, investors and Food and Beverage (F&B) businesses must prepare for continued volatility and long-term shifts in consumer consumption patterns.
Key themes for 2025
- Structural shift in consumer behavior
- Three dimensions of disruption
- Cycling & reengagement volatility
- Strategic implications for brands & investors
- Key insights and facts from the four trends:
Structural Shift in Consumer Behavior:
GLP-1 medications like Ozempic and Wegovy are altering how people eat by reducing appetite, meal frequency, and cravings, leading to material reductions in F&B consumption, particularly among high-fat, high-sugar, and impulse-driven categories.
Three Dimensions of Disruption:
-
Category-Level Impact: The most significant consumption declines among GLP-1 users are occurring in categories like salty snacks, baked goods, and cookies. While there’s little evidence of a corresponding rise in healthier category spending, protein-rich and functional foods are showing notable resilience in the shifting landscape.
-
Occasion-Based Changes: GLP-1 medications are impacting eating habits by reducing meal frequency, portion sizes, and overall food intake. Non-essential eating occasions, like late-night snacking and social dinners, have seen notable declines. Away-from-home (AFH) dining has been especially affected, with early research indicating a 6 percent drop in spending during the first six months of use.
-
Demographic Skew: GLP-1 usage is currently concentrated among higher-income, middle-aged adults (35+), who very seldomly represent "super users" – high-frequency and high-value consumers - in key F&B categories. As a result, a number of food & beverage categories are somewhat insulated from the impact of changing behaviors of GLP-1 users.
Cycling and Reengagement Volatility
Sixty percent of users discontinue within six months, but often regain weight and express interest in restarting, meaning it's difficult to predict volume and demand.
Strategic Implications for Brands and Investors
GLP-1s are not a temporary fad, but a structural headwind for the F&B industry. However, they are navigable with smart, adaptive strategy. As usage becomes more widespread, regulatory and labelling shifts are also likely to reshape how products are marketed and sold.
Franchisors Falling Behind in Meeting Consumer Expectations
A new study from LT highlights a widening gap in the franchise industry: while consumer expectations have rapidly evolved, franchisor investments have not kept pace. The report “The Gaps That May Be Killing Your Franchise: Changing Consumer Expectations & Where to Invest” draws on input from 83 franchisor leaders and more than 1,000 consumers, examining how national brands across industries are navigating changing demands and how much ground they still have to cover.
Key findings include:
-
Consumers expect consistency, and 63 percent will pay more for it. Across industries, the majority of consumers are willing to spend extra for consistent experiences, and trust plays a major role in driving repeat business, yet only a third of franchisors feel confident delivering it.
-
Social platforms are now primary discovery engines: 50 percent of consumers have used Instagram, TikTok, YouTube or Reddit to search for local businesses. And that number increases significantly with younger audiences (77 percent of Gen Z & 65 percent of Millennials).
-
Only 39 percent of franchisors plan to adopt AI tools in the next two years, even as customers demand more personalization, speed and are using these tools to search.
-
76 percent of consumers say they trust businesses they perceive as local, and only 34 percent believe franchises offer better customer service than local businesses.
Lunchtime Trends
More than half of Americans skip lunch in order to work more, according to a recent survey.
The poll of 2,000 employed Americans, with a quota of 1,000 working parents with school-aged kids, revealed that 55 percent forgo eating lunch on hectic days to be more productive.
Respondents also admitted to completely forgetting to eat lunch two days out of the work week, on average.
In fact, more than four in 10 workers (43 percent) rely on reminders to eat a midday meal, with women being significantly more likely than men (63 percent vs. 48 percent) to need a reminder to eat during the workday.
Commissioned by Buddig for National Sandwich Month in August and conducted by Talker Research, the survey found that although 63 percent of working Americans eat a full, substantial meal for lunch most days, a significant number (37 percent) confessed to eating more of a snack for lunch, or grazing on little snack foods throughout the day in place of a meal.
More than one in 10 (13 percent) also admitted they’ll typically work and eat lunch at the same time on a regular workday, instead of taking a break from their tasks to eat.
Looking at differences between subgroups, men (91 percent) are more likely than women (85 percent) to pause their work to eat lunch, and hybrid workers (94 percent) are more likely than remote (85 percent) and in-person employees (87 percent) to take a true lunch break.
A third of employed Americans (33 percent) also revealed that they’ll usually eat their midday meal at their desk or workstation, with remote workers being more guilty of this (41 percent) than hybrid (38 percent) and in-person (28 percent) respondents.
On average, workers eat lunch at 12:48 p.m., and their typical lunch hour is actually only 35 minutes, on average.
For those who step away from their work to eat, many (43 percent) multitask during their downtime, with women being more likely than men (51 percent vs. 33 percent) to multitask while eating lunch.
And multitaskers most commonly check social media (70 percent), text (64 percent) and make phone calls (55 percent) during their lunch hours, even though most respondents (84 percent) agreed that taking offline lunch breaks, sans screens or technology, is good for their health.
On a typical workday, 62 percent of employed Americans usually bring lunch from home, a third (33 percent) will buy it and 5 percent are lucky enough to have their meal provided by their employer.
Three-quarters of workers (75 percent) said that sandwiches are their go-to lunch meal, and 70 percent of those with school-aged kids said their kids also include sandwiches among their lunchtime favorites.
Looking closer at mealtime menus for both parents and kids, working Americans cited sandwiches (64 percent), salads (45 percent) and hamburgers (33 percent) as their most common lunch staples, and those with kids in school said their children will eat sandwiches (58 percent), pre-made meal kits (36 percent) and pizza (30 percent) most often.
Health-wise, the quality of working parents’ meals falls a bit behind their kids’. While 83 percent of parents with school-aged kids said their children’s lunches are healthy, only 74 percent could say the same for themselves.
The results also revealed that hybrid workers reported eating the healthiest lunches (79 percent) compared to remote (71 percent) and in-person (65 percent) workers.
And surprisingly, those whose lunches are catered by their employers reported having healthier lunches (75 percent) than those who bring homemade lunches (72 percent) and buy lunch (62 percent).

Beverages of Choice
A new report from the Harris Poll that offers fresh insights into Americans’ beverage choices when restaurant dining.
The study reveals compelling trends that reflect shifting preferences across age groups:
-
Water and soda remain popular across all generations, but alcohol still holds a strong place, especially among millennials and Gen Xers. Over a third of Americans say alcohol is their "go-to" restaurant beverage, edging out soda and water.
-
Millennials stand out as loyal repeat customers for alcoholic drinks, ordering beer, spirits, and wine significantly more than Gen Z in the past 30 days.
-
Gen Z shows a more varied approach to drinking, balancing alcoholic and non-alcoholic options, with a particular interest in novelty and "Instagram-worthy" beverages.
-
Non-alcoholic beverages like mocktails have a steady following but are mostly enjoyed by those who also drink alcohol, rather than by young adults who abstain entirely.
-
Beverage preferences often fall along generational lines: millennials and Gen X prefer alcoholic drinks, while Gen Z favors soda, and baby boomers choose water.
-
Alcohol brands are advised to focus on their core consumers: millennials and Gen X. Nevertheless, these brands should not overlook Gen Z, who respond well to creative and fun new beverage options.
"We're watching two different philosophies play out at the same table: millennials treat alcohol as their ticket to transform ordinary meals into curated experiences, while Gen Z approaches drinking like a strategic choice - they'll sip a craft cocktail or a soda with equal enthusiasm, depending on what fits their mood and wallet," said Libby Rodney, Chief Strategy Officer at The Harris Poll.
The United States of Ranch
Forget politics; America’s real divide might be over ranch dressing. Across the country, younger diners aren’t just eating ranch, they’re reinventing it. And depending on where they live, their idea of “the perfect ranch” looks completely different.
Rubix Foods’ United States of Ranch map reveals a patchwork of flavor loyalties across the country, offering operators insight into local menu relevance. In the Mountain West, Buffalo ranch dominates from Nevada to Nebraska. On the West Coast and throughout the Midwest, Pizza Ranch is the fan favorite.
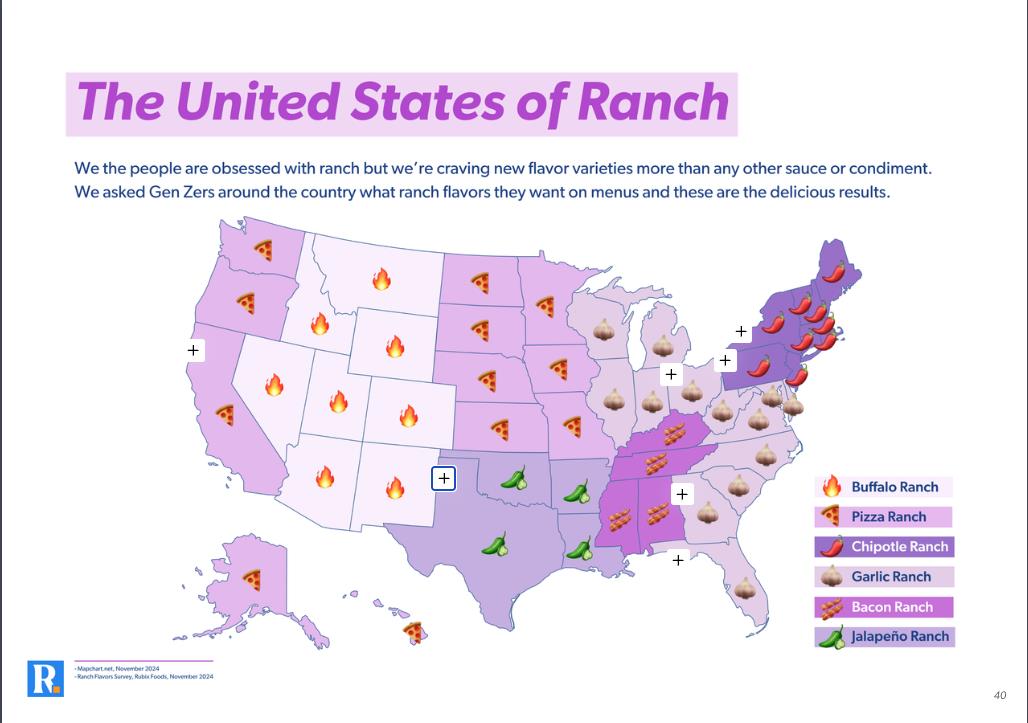
Some respondents strayed from their regional preference: while Ohio primarily demonstrates a taste for garlic ranch on menus, 44 percent of Ohio Gen Zers were also interested in trying bacon ranch. Fifty percent of Gen Zers in Georgia want to mix it up with hot honey ranch, and 45 percent of Gen Zers in Pennsylvania are interested in trying ghost pepper ranch.
The data, collected by Rubix Foods, indicates bigger menu trends hinged on ranch:
- 21 percent of Gen Z say classic ranch is overrated, twice as many as any other flavor.
- 44 percent of Gen Z want fresh takes on ranch, proving the classic is ripe for reinvention.
- Google searches for “new ranch flavors” are up 250 percent in the past year.
This map has the potential to serve as a literal road map for operators. With 90 percent of Gen Z willing to visit a restaurant just for a sauce they love, sauce strategy isn’t something to skimp on. Menu developers can tailor LTOs and regional drops that feel custom-built for their markets, while national brands can design multi-market promotions with hyperlocal appeal.
Customer Acquisition and Retention in an Imperfect World
A new report by Publicis Sapient and Adobe, "Customer Acquisition and Retention in an Imperfect World," sheds light on the trends reshaping the Travel and Hospitality industry. It is based on a survey of over 250 executives in North America across the Travel and Hospitality industry, including the dining sector.
The findings underscore a critical juncture for the dining sector. As customer acquisition costs rise and loyalty becomes increasingly elusive, dining brands must pivot towards more effective personalization and identity resolution strategies, while also innovating to meet the expectations of the next generation of consumers. The benefits are clear: substantial cost savings and enhanced customer experiences that drive long-term loyalty.
Among the findings:
1. Customer Acquisition Costs Are on the Rise: From 2022 to 2025, the cost to acquire a customer in the dining industry surged by 24.7 percent, from $13 to $16. Despite this increase, customer lifetime value only rose 10.2 percent from 2022-2024.
2. Personalization Hindered by Lack of Sophisticated Segmentation: Personalized offers have proven to be the most effective retention tactic, delivering the highest ROI for 75 percent of travel and hospitality firms. However, the industry faces a significant challenge in implementing sophisticated personalization strategies, highlighting a gap between the recognized importance of tailored engagement and its practical execution. For example, only four percent of executives in the dining sector said that they use sophisticated segmentation. The lack of sophisticated segmentation capabilities is a barrier to dining establishments delivering truly personalized experiences.
3. Improved Identity Resolution Can Reduce Costs: 77 percent of travel and hospitality firms unknowingly targeted their own loyalty program members through paid media in 2024. An estimated 27 percent of digital customer acquisition budgets are wasted on targeting existing customers. With perfect identity resolution, dining establishments could reduce customer acquisition costs by an estimated 31 percent. This creates an opportunity for dining brands to gain competitive advantage through more sophisticated data infrastructure, reducing spending while also delivering more personalized experiences that drive conversion and loyalty.
4. Opportunity for Increased AI Integration Across Travel and Hospitality: While some travel and hospitality firms have implemented AI in customer-facing channels like chatbots (14 percent) and mobile apps (11 percent), more sophisticated applications that could drive significant business impact remain largely unexplored. Only 8 percent have implemented AI for offers and promotions, 7 percent for loyalty programs, and five percent for CRM.
5. Brands Must Address Generational Strategy Gaps: A staggering 82 percent of firms across the travel and hospitality industry either have no generational strategy or only ad hoc efforts. In the dining sector, 54 percent of executives said they believe they meet the digital expectations of Gen Z customers. Gen Z represents 28 percent of loyalty program members in the dining sector. With Gen Z poised to become a dominant consumer group, dining brands must innovate to meet their digital expectations and engage them meaningfullyin loyalty programs to keep this momentum.
The State of Tipping
-
California leads the list of states where customers are tipping the least in 2025, with the smallest tips of 17.8 percent of the total bill in the ranking.
-
Standing out with the lowest waitstaff wages is Minnesota, at 11.8 USD per hour.
-
Connecticut is third, with small tips, but the highest annual income at 78.8K USD.
2025 data shows that nearly nine in 10 Americans think tipping culture has gone too far, which is a sharp increase from around 75 percent who thought the same last year. A recent study by BLogic Systems analyzed tipping habits across the U.S. to identify the states where customers are tipping the least in 2025. The research focused on wages of both customers and waitstaff, as well as average tips and tipping fatigue score. The final ranking is based on the generosity index, which reflects the public sentiment of the state residents towards tipping.
Here is the summary of the findings:
|
State |
Avg Tip percent |
Annual Real Income of Population USD) |
Waitstaff Median Wage ( USD) |
Waitstaff Median Hourly Wage ( USD) |
Tipping Fatigue Score |
Generosity Index |
|
California |
17.8 |
72K |
35K |
17 |
91.71 |
24.5 |
|
Washington |
18.3 |
73K |
47K |
22.8 |
96.27 |
24.8 |
|
Connecticut |
19.8 |
78K |
36K |
17.5 |
92.41 |
25.1 |
|
Massachusetts |
20 |
78K |
36K |
17.5 |
86.82 |
25.4 |
|
New Jersey |
19.5 |
72K |
38K |
18.6 |
86.17 |
26.8 |
|
New York |
19.1 |
71K |
46K |
22.3 |
87.64 |
26.8 |
|
Maryland |
19.7 |
67K |
35K |
16.9 |
90.05 |
29.3 |
|
Virginia |
19.7 |
67K |
36K |
17.8 |
86.7 |
29.3 |
|
Minnesota |
19.3 |
65K |
24K |
11.8 |
99.03 |
29.6 |
|
Florida |
18.5 |
62K |
29K |
14.2 |
84.69 |
29.6 |
The state where customers are tipping the least in 2025 is California, with a generosity index of 24.5, reflecting low public sentiment towards tips. The state stands out with the lowest tips in the top 10, at only 17.8 percent of the total bill, as well as with a high tipping fatigue. At the same time, the media hourly wage for the waitstaff in California amounts to 17 USD.
Washington is in second place among the U.S. states that tip the least, with a generosity index of 24.8. The waitstaff wages in Washington are the highest in the top 10, at 22.8 USD per hour, which can explain low interest in tipping. The state residents also have the second-highest tipping fatigue score, and their tips are the second-lowest at 18.3 percent.
Connecticut ranks third, getting a generosity index of 25.1. The tips here are usually higher than in Washington and Connecticut at 19.8 percent, but waitstaff wages amount only to 34.6K USD annually, while Connecticut residents have the highest income at 78.8K USD.
Massachusetts follows closely with fourth place and an index of 25.4. The state stands out with the highest tips in the top 10, at 20 percent of the total bill, but waitstaff wages remain low, at a similar 17.5 USD per hour.
New Jersey is fifth on the list of states where customers are tipping the least in 2025, with a generosity index of 26.8. People in New Jersey tip less than in Massachusetts or Connecticut, while tipping fatigue remains high, with a score of 86.1.
In sixth place is New York, getting a similar index of 26.8. People in the state of New York tip less than in New Jersey, leaving only 19.1 percent. At the same time, New York waitstaff wages are quite high, compared to other states on the list, with 22.3 USD per hour, getting the second-highest waitstaff salary of 46.4K USD.
Maryland comes in seventh, with a generosity index of 29.3. Maryland residents tip a little less than in Connecticut, with 19.7 percent, but the waitstaff wages here are much lower. On average, waiters here earn only 16.9 USD per hour, the third-lowest wage in the top 10.
Virginia follows closely in eighth place, with a similar 29.3 index. People here tip the same 19.7 percent on average, just as in Maryland, but the tipping fatigue among residents is a little lower, with a score of 86.7.
Minnesota is ninth, getting a generosity index of 29.6. The state stands out with the lowest waitstaff wages, with waiters here earning only 11.8 USD per hour. At the same time, tips here are one of the lowest in the top 10, totalling 19.3 percent of the bill.
Florida rounds up the top 10 U.S. states that tip the least, in tenth place, getting an index of 29.6. The state offers the second-lowest wages to the waitstaff, at 29.5K USD annually, making tips crucial for the waiters. Residents in Florida usually tip 18.5 percent, even with the lowest tipping fatigue in the top 10.


